Write table and figure captions that readers can understand
Make tables and figures intelligible with a display-to-caption map, fictional before-and-after examples, precise notes and a blind-read check.
About 13 min read · Allow extra time for the practical checks
“Figure 2. Results” identifies a display but does not explain it. A reader still needs to know what the marks represent, which panel to read, what the units mean and whether a line shows an observed connection or a proposed one.
If you have not yet decided which display best fits the comparison, start with the guide to choosing a chart for your data question. This page covers how to explain a table or figure once you have selected it.
Good captions and table notes supply that decoding context. They do not rescue an unsuitable analysis, establish a causal conclusion or turn an unverified image into evidence. The task begins with a display whose content has already been checked.
This guide provides a display-to-context map, an original fictional table and a two-panel diagram, followed by a blind-read audit. The examples demonstrate writing decisions rather than a universal journal format. Follow your actual assignment, discipline, style guide and target journal.
Separate the jobs before writing the caption
Writers sometimes use caption for everything attached to a display. That can conceal several different jobs:
- The number gives the display a stable identity.
- The title identifies its subject and scope.
- Headings, axes and labels identify the displayed quantities or elements.
- A legend or key explains visual encodings such as symbols and line styles.
- Notes supply necessary definitions, qualifications and source information.
- The body-text callout directs attention to a relevant feature and explains its place in the argument.
Not every display needs every element. A simple labelled diagram may need no separate key. A statistical plot may need explicit units, analysis-specific sample information and a verified definition of its interval bars.
The important question is not “Have I written a long enough caption?” It is “Can the reader decode what is actually here?”
Purdue OWL’s APA tables-and-figures guide distinguishes titles, legends and notes and connects displays to their text references. Its detailed typography and placement rules are APA-specific, not instructions for every publication.
Check the required style without confusing it with meaning
Record the governing requirements before polishing punctuation: numbering scheme, title placement, note format, panel labels, abbreviation rules, source-credit wording and any separate figure-file instructions.
Monash’s article-structure guidance explicitly notes that caption placement varies by journal and style. Do not apply “all figure captions go underneath” as a universal rule.
A meaningful title remains necessary whichever position the style requires. Conversely, correct italics do not make “Group comparison” informative.
If a display is supplementary rather than essential to the main argument, first decide whether it belongs in an appendix. Keep the essential finding and interpretation in the body, then check the appendix display’s title, notes and exact reference using the same decoding principles.
Use separate table and figure sequences where required, and refer to the exact identifier rather than “the image below.” Position can change during export or typesetting. If a figure has panels A and B, the callout and explanation must use those same labels.
The numbered teaching examples here are local to this guide. They are not numbering instructions for your manuscript, and the surrounding diagnostic tables are reading aids rather than additional numbered study outputs.
Build a display-to-context map
Before drafting, connect each visible element to the information needed to understand it. Use your checked output, codebook, design record or original source, not an assumption about what the visual probably means.
On a narrow screen, scroll the table sideways to read every column.
| Visible element | Question to resolve | Likely home | If unknown |
|---|---|---|---|
| Display as a whole | What subject, setting and period does it show? | Informative title; note for essential detail | Check the study/output record before naming a scope. |
| A number or axis | Which variable, unit, scale and contributing cases? | Heading or axis; supporting note | Query the analyst or data owner; do not infer units. |
| Bar, band or whisker | What exact quantity or uncertainty measure is represented? | Key or note, with method context where needed | Keep unresolved; appearance does not identify SD, SE or a confidence interval. |
| Panel, colour or line | Which condition, stage or relationship does it encode? | Direct label, panel explanation or key | Check the originating specification. |
| Asterisk, letter or blank | Is it a note marker, test result, missing value or something else? | Specific note tied to the exact mark | Do not assign a conventional meaning automatically. |
| Borrowed content | What source, modification and reuse conditions apply? | Credit note and required reference entry | Locate the source and check licence or permission requirements. |
| Text reference | What feature matters to this paragraph? | Body-text callout | Reconsider whether the display serves the argument. |
“Likely home” is an organising recommendation. Your journal may combine the title, key and explanatory note differently. Avoid hiding essential context in a distant methods paragraph simply because the caption feels crowded; first remove repetition or improve the display’s own labels.
If the underlying summary is not yet justified, use the descriptive-statistics table guide. If counts change between analyses, use the denominator-reporting guide. A caption should accurately report those decisions, not make them on the analyst’s behalf.
Repair a fictional table without changing its evidence
Wholly fictional teaching case: Larchfield Learning Centre keeps a four-week equipment-desk log. The centre, dates and records are invented. The checked case specification states that each completed loan creates one transaction record; one borrower can have several loans. The log contains 18, 22, 16 and 24 completed loans for weeks 1–4 respectively. All four weekly counts are available. It contains no before-pilot comparator or learning-outcome measure.
The incoming display is headed “Table 1. Usage.” Its columns are “Week” and “Number,” with the four values above. There is no note.
The values may be correct, but the reader cannot tell whether “Number” counts people, requests or loans. Calling it “students served” would introduce an error. The repair must use the supplied transaction definition.
On a narrow screen, scroll the table sideways to read every column.
| Pilot week | Completed loans, count |
|---|---|
| 1 · 1–7 March | 18 |
| 2 · 8–14 March | 22 |
| 3 · 15–21 March | 16 |
| 4 · 22–28 March | 24 |
Note. All entries are invented teaching data. Counts represent completed loan transactions, not distinct borrowers; one borrower may contribute several transactions. All four weekly counts are available in the fictional log.
The repair has three traceable parts. The title supplies subject, setting and period. The column heading names the counted event. The note prevents repeated transactions from being read as distinct people.
A suitable fictional body-text callout is:
Table 1 records the most completed loans in week 4 and the fewest in week 3. These transaction counts do not show how many distinct borrowers used the desk or whether the pilot improved access.
That passage selects a relevant feature and limits its meaning. It does not copy all four rows into prose. “Table 1 proves rising demand” would be inaccurate: the sequence is not steadily increasing, and completed loans alone do not identify unmet demand.
Do not add a sample-size symbol, percentage or statistical test merely to make the table appear more academic. None is needed to decode these four supplied counts.
Keep note markers attached to what they qualify
A correct note can become misleading when a table changes. After sorting rows, removing a category or splitting a display, check both the note’s wording and the entry it now accompanies. The earlier distinction between a table-wide note and a qualification of one part still matters during revision.
Everything in this additional example is wholly fictional teaching material. The records and revision describe no real source collection, missing reference or software behaviour.
Imagine a report includes two catalogue records. Its checked working record identifies:
- R-17: an entry guide whose source locator still needs confirmation. The incoming table marks this row with a specific note saying “Source locator not yet confirmed.”
- R-02: a reading list whose locator is confirmed. No unconfirmed-locator qualification is supplied for it.
The writer changes the row order to R-02 followed by R-17 but accidentally leaves the note marker beside the first row. The note’s sentence remains correct about R-17, yet its apparent referent is now wrong. The reader is told that R-02 has an unconfirmed locator, and R-17’s unresolved point disappears from view.
Reading the note alone would not expose the error. Repair the attachment using the checked item identity, then inspect the marker sequence required by the governing style. Do not change the factual qualification merely to match an accidental layout. A consistent-looking table can still misrepresent its record.
For each note in the final display, identify the exact row, column, cell or display-wide feature it qualifies and compare that attachment with the checked source. If its target was removed, decide whether the note should disappear or whether the substantive limitation still belongs elsewhere. A marker with no note, or a note with no identifiable target, needs attention; deleting an unresolved limitation solely to remove a formatting inconsistency is not a repair.
After the final export, inspect the display, its notes and its body-text callout together. Confirm that the qualification remains legible and its target identifiable. This checks documentary attachment and readability; it does not establish that the underlying values or source decisions are correct. Keep unresolved factual questions visible until the appropriate record can settle them.
Make each panel of a figure identifiable
A multi-panel caption must explain both the shared subject and what distinguishes the panels. “Before and after” is inadequate if the actual diagram compares an existing process with an untested proposal.
In Figure 1, the fictional centre is considering adding a return-check record to its equipment workflow. The checked design brief describes panel A as the documented pilot process and panel B as a proposal. It defines solid arrows as recorded process order and dashed arrows as proposed order. Neither arrow style represents a measured effect.
The weak incoming caption is “Figure 1. Improved loan system.” It assumes improvement before evaluation and leaves the panels and arrows unexplained.
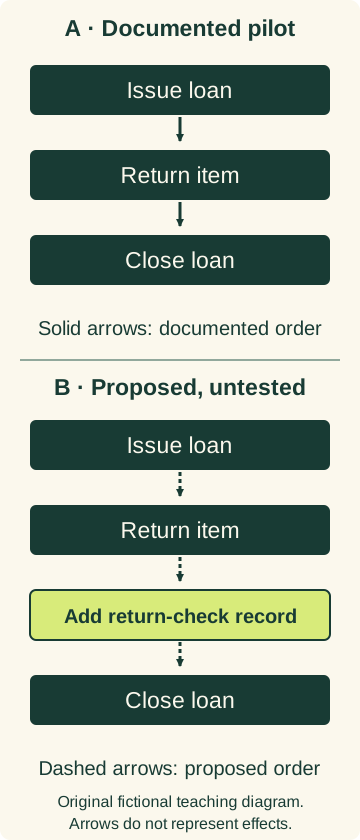
Note. Original fictional teaching diagram. A: documented process during the 1–28 March 2026 pilot. B: proposed process adding a return-check record before closure; not implemented or evaluated in this case. Solid arrows indicate the documented order of steps; dashed arrows indicate proposed order. Arrows do not show elapsed time or causal effects.
The figure can also be read as text: A follows issue loan → return item → close loan. B follows issue loan → return item → add return-check record → close loan. The title, panel headings and note distinguish documentation from proposal without relying on colour.
A useful body-text callout is:
Figure 1B places the proposed return-check record between item return and loan closure. This additional recording step would need testing before any claim that it reduces errors or delays.
The conditional sentence describes the proposal, not an observed result. The caption does not claim efficiency, effectiveness or endorsement. A more persuasive-sounding title would be a worse title if it misrepresented the diagram.
Test the connection from display to explanation
For the two fictional examples, the context map should close each decoding question with something visible and checkable:
On a narrow screen, scroll the table sideways to read every column.
| Reader's question | Verified case detail | Where the repair supplies it |
|---|---|---|
| What does 24 count? | Completed loan transactions in week 4 | Table column heading and week label; note distinguishes borrowers. |
| Which period is covered? | Four pilot weeks, 1–28 March 2026 | Table title and row labels; Figure 1 note identifies the documented process period. |
| Are A and B both observed? | A is documented; B is an untested proposal. | Figure title, panel headings and note. |
| Do the arrows mean an effect? | No; they identify process order. | Figure key and note explicitly decode solid/dashed arrows. |
| Has improvement been established? | No outcome comparison is supplied. | The revised callouts preserve that limit instead of asserting success. |
Apply the same test to your own output. If a detail exists only in your memory, it is not yet available to the reader. If it does not exist in the record, adding confident wording is not a repair.
Keep a query such as “Please confirm what the error bars represent and which observations contributed” open until the responsible person supplies a verified answer. Do not publish a guessed definition and plan to correct it later.
Keep source credit separate from decoding and permission
An original display of your own checked material, an adapted diagram and a reproduced image have different provenance. Record which you are using.
Monash Library’s APA tables-and-figures examples show source details in both a display note and a reference entry. Follow the actual style for the author, date, source title, locator and adaptation or reproduction wording. A bare URL may not supply the required credit.
Attribution and permission are separate checks. A citation does not by itself establish that reuse is allowed. Inspect the actual licence, rights information and institutional or publisher requirements; seek appropriate advice if unresolved. Do not write “reproduced with permission” unless that statement is true.
For confidential or participant-related material, permission to conduct a study does not automatically authorise publishing every image or identifying detail. Use the study’s approved disclosure process and do not share restricted material merely to obtain caption feedback.
The Larchfield examples are original inventions. Their fictional record labels are not external references, and their wording must not be presented as results from a real centre.
Run a blind-read audit on the final output
Hide the surrounding analytical paragraphs and inspect the display with its title, key and notes. Ask a colleague to do the same if appropriate and permitted.
- Can the reader identify the subject and relevant setting or period?
- Can they tell what each row, column, axis or panel represents?
- Are units, scale directions and necessary abbreviations explicit?
- Can they distinguish observations, proposals and interpretations?
- Does every meaningful symbol or line style have a verified explanation?
- Are contributing cases, denominators or uncertainty measures clear where needed?
- Are qualifications and provenance attached to the correct display?
- Does the body text cite the exact number and panel, not a location?
- Is every claim consistent with the actual display and checked record?
- Does the exported submission preserve labels, notes, legibility and reading order?
This is a practical editorial audit, not a validated scoring instrument. A reader’s successful decoding does not establish sound design or analysis.
Inspect the required submission format at its intended size. A note that was readable in the working file can become separated, clipped or too small after export. Supply appropriate text alternatives for informative visuals; decorative article artwork is a different case. Do not rely on colour alone or assume an image’s filename acts as its explanation.
Where permitted, academic editing can identify ambiguous labels, inconsistent cross-references and missing explanations in your own draft. Authors remain responsible for the study, analysis, accurate source credit and permissions. Uncertain technical meaning should return to the researcher or analyst rather than being invented by an editor.